Our latest PhET simulation dealt with lasers, giving us hands-on (I mean, as hands on as a computer simulation can be, which is much more hands-on than a lecture) experience playing with the variables involved in creating a laser. And by playing, I do mean playing–this project was a blast, and the sense of accomplishment when my group achieved lasing was only matched by our ecstatic whoops when we managed to tweak it into the danger zone. Curious to achieve this delightful result for yourself? You can access the simulation, the assignment, and my report.
Quantum Tunneling Simulation
A week before Spring Break, we did another PhET simulation, this time on quantum tunneling and wave packets. We dealt with wave packets in three scenarios: free particle (no barriers), step potential, and barrier potential. My procedure and analysis follow.
1. Free Particle
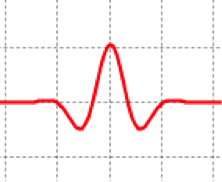
- Using a wave packet, potential = 0, describe the stationary wave function .
- It’s localized.
- It has an absolute maximum in the middle, and equal relative minima on each side.
- It has real and imaginary parts; these elements are out of phase with each other.
- It has a probability distribution, with the maximum probability of the particle’s location at the peak amplitude of the wave packet.
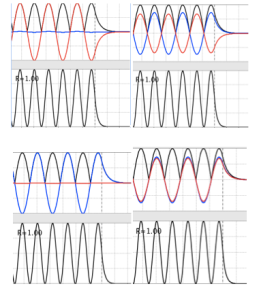
Figure 1: real part of a wave packet representing a free particle
- Vary the energy and describe the change in the wave function.
- As energy decreases, the local minima on the sides become smaller until they smooth out completely. The maximum in the middle retains its amplitude.
- As the energy increases, the wave packet adds additional local maxima and minima.
- With E ≤ V, the wave completely flattens out.
- Things that don’t change with variation in E:
- Probability density
- Width of the wave packet
- Imaginary and real parts still out of phase
- Explain why this change occurs.
- As the energy increases, more k-vectors are being added, so more waves are included in the composite wave packet, and more local maxima/minima are observable.
- Change the potential and describe and explain the resulting change in the wave function.
- As potential increases, the packet stretches out: fewer oscillations take place in the same region.
- As potential decreases, the packet squeezes more oscillations into the same region.
- The width of the packet and probability density remain unchanged, and the real and imaginary parts continue to be out of phase with each other.
- Now make a wave packet and let it evolve through several fs. Look at the magnitude as well as the real part of and describe the changes. Do the wave function wave fronts move at the same speed as the packet?
- The wave packet quickly spreads out, with the probability density spreading as well. (It’s still centered at the greatest magnitude of the wave packet.)
- The envelope moves slower than the individual wave fronts (phase velocity > group velocity), causing the spreading.
Figure 2: real and imaginary parts of a Gaussian wave packet, illustrating spreading through several fs
- Describe the difference between the behavior of a plane wave and a wave packet.
- A plane wave doesn’t describe a particle, so its probability density is infinite (which isn’t meaningful as a probability).
- The magnitude of the plane wave is constant through space.
- Changes in V and E change the wavelength, but not the amplitude, of the plane wave.
- While the wave propagates, the envelope of the plane wave doesn’t evolve through time.
2. Step Potential
- Create a step potential and a de Broglie particle. Set E ≥ V and adjust the step so that V = 0. Increase the step (still V ≤ 0) and describe and explain the change in the wave function.
- With E ≥ V, the wave packet approaches the step. When it hits the step, part of the wave is reflected, and part of the wave continues through the step. The wave function and probability density change on each side of the step, with them both falling off more quickly inside the step than on the reflection side of the step. With increasing energy, the transmission probability increases and the reflection probability correspondingly decreases.
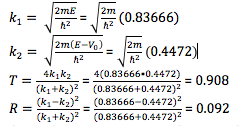
- Given an energy value, (pick and show) calculate and verify the (relative) amplitudes of the incident, reflected, and transmitted stationary wave functions, and the transmission and reflection probabilities. (You can choose to show the summed or separated incident wave parts.)
- Chosen parameters:
- E = 0.7 eV
- V = 0.5 eV
- PhET values:
- R = 0.09
- T = 0.91
- Calculation:
- Chosen parameters:
- Look also at the imaginary parts of the wave packet. Describe and explain the difference between the imaginary and real parts (phase).
- The imaginary and real parts exhibit the same falling off pattern, but with slightly different phases. During the tunneling phenomenon, the phase difference of the imaginary and real parts decreases—they get closer to being in sync.
- Increase the step so that V ≥ E. What happens? Compare the real and imaginary parts. Is it similar to the other case? Describe and explain.
- With V > E, the T = 0 and R = 1.0.
- The real and imaginary parts shift into and out of phase with each other.
- Compare the difference in behavior between a plane wave and a wave packet.
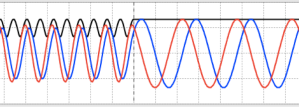
- On the incident side of the step, the plane wave’s real and imaginary parts oscillate continually from more in phase to more out of phase.
- On the transmission side of the step, the plane wave’s real and imaginary parts become “locked together”, traveling with constant phase shift.
Figure 3: phase shifts in a plane wave with a step potential.
-
- The probability density of the plane wave is periodic on the incident side of the step, and constant on the transmission side.
- Raising the energy relative to the height of the step shortens the wavelength, raises the transmission coefficient, and decreases the amplitude of the probability density as well as the amplitude of the wave on the incident side of the step.
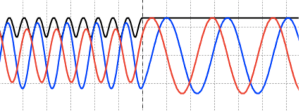
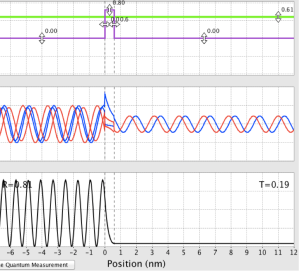
- An interesting phenomenon happens when E < V: the transmission coefficient drops to 0, and the real and imaginary parts on the incident side of the step shift into and out of phase with each other as the reflected wave interferes with the incident wave. The probability density is zero at the nodes, but isn’t immediately zero on the transmission side of the step (inside the step). It drops off quickly, but there’s a short distance during which the de Broglie particle penetrates the step: quantum tunneling. This phenomenon is also reflected in the graph of the wave function.
Figure 4: Plane waves exhibiting shifting phases and quantum tunneling with a step barrier
3. Barrier Potential
- With E > V, describe how varies over and beyond the barrier, and explain why.
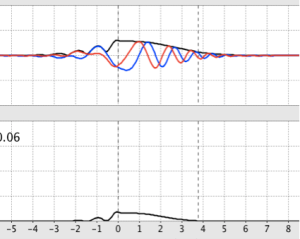
- As the wave packet crosses the barrier, its wavelength is stretched. Some of the wave packet is transmitted, and some is reflected.
- On the other side of the barrier, the transmitted wave continues and eventually decays, and the probability density decreases as the wave packet delocalizes.
- This stretching or spreading occurs because the wave packet spreads out proportionally to 1/t^2, which can be demonstrated through manipulating integrals deriving from the Taylor series expansion about zero of the wave function, resulting in a probability function distributed over more space to maintain constant probability.
Figure 5: Behavior of wave packets across a barrier
- Now set E ≤ V and describe the change. What is T?
- With E ≤ V, the form of the wave doesn’t look very much different than with E ≥ V. However, T is now 0, so the wave on the far side of the barrier has tunneled through and, consequently, falls off quickly.
Figure 6: Behavior of a wave packet with a barrier and E ≤ V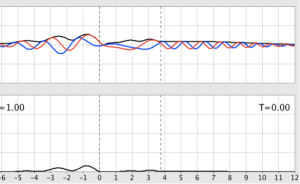
- Can you make T ≥ 0? Under which conditions, keeping E ≤ V?
- When the barrier is thin enough, even E < V produces T > 0.
- Construct yourself a barrier like Fig. 3.6 in Morrison. Determine the ratio of the amplitudes E/A and verify your expression with the output from the program. You may want to choose a barrier of 0.8 eV and a width of 1 nm. Choose as electron energy 0.6 eV.
- Note: the program wouldn’t let me choose an energy of 0.6 eV, so I used 0.61 eV.
- Successively increase the width of the barrier until there is no transmission anymore. Plot the transmission coefficient as function of barrier width. Can you relate your graph to the analytic expression for the transmission coefficient?
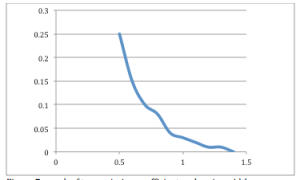
Figure 7: graph of transmission coefficient vs. barrier width
- In the above graph, the x-axis is barrier width in nm, and the y-axis is the transmission coefficient.
- The expression for the transmission coefficient is
- This leads us to expect an exponential decay in T as barrier width increases, and the graph confirms our expectation.
- Compare the difference in behavior between a plane wave and a wave packet when they scatter from the barrier potential.
- Plane waves act in a similar way when scattering from this barrier as they do when scattering from the step potential barrier: they approach and reflect to make a composite wave on the incident side whose real and imaginary parts oscillate into and out of phase; on the far side of the step, the waves which have successfully tunneled through and re-emerge exhibit increased wavelength, decreased amplitude, and a constant probability density.
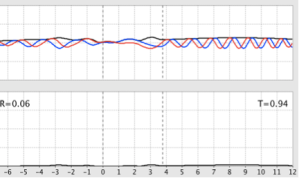
- When the incident/reflected waves are displayed, the simulation displays some interesting discontinuities in either the real or the imaginary part (pictured below). Note that the observables (probability density and reflection/transmission) are smooth.
- The reflected waves also exhibit slightly decreased magnitude.
Figure 8: discontinuities in reflected plane waves from a potential barrier
De Broglie and the Wave Hypothesis
Louis de Broglie (1892-1987) was a French theoretical physicist who contributed an extremely important idea to the development of quantum mechanics. The de Broglie hypothesis, forwarded in his doctoral dissertation in 1924 [1], states that each particle has an associated wavelength, and presents a relation to determine the wavelength from the particle’s observables [2,3]. This hypothesis was gleaned from de Broglie’s analysis of the existing quantum theory, especially Einstein’s descriptions of the photoelectric effect and relativity [2].
Although de Broglie was a brilliant physicist who received the 1929 Nobel Prize for his work [1], he originally was a passionate student of literature and received a degree in history [1]. After receiving this degree, he returned to college to pursue studies in physics. These studies were interrupted for a four-year period during World War I, for the entirety of which de Broglie was stationed at the Eiffel Tower–not a bad way to serve, all things considered [1]. After the war, he returned to his physics studies once again and received his doctorate, as mentioned, in 1924. Following graduation, he served on the faculty of several French scientific institutions and received numerous awards for his efforts in research and lay-education [1].
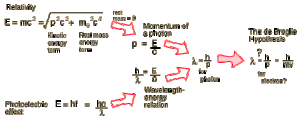
This diagram, published on the Georgia State University’s “HyperPhysics” site, helpfully illustrates the theoretical foundation of de Broglie’s hypothesis [2].
Notably, this hypothesis was confirmed in 1927 by the Davisson-Germer experiment, which demonstrated interference patterns in electrons scattered from a crystal, consistent with a wave description of the electrons [1,2,3]
References:
[1] “Louis de Broglie – Biographical”. Nobelprize.org. Nobel Media AB 2013. Web. 1 Mar 2014. <http://www.nobelprize.org/nobel_prizes/physics/laureates/1929/broglie-bio.html>
[2] “Wave Nature of Electron”. Gsu.edu. Georgia State University, n.d. Wed. 1 Mar 2014. <http://hyperphysics.phy-astr.gsu.edu/hbase/debrog.html>
[3] “Modern Physics for Scientists and Engineers”. Morrison, John. Publisher, year. Print.
Photoelectric Effect Simulation
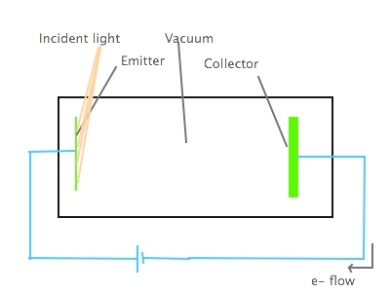
One of the first experiments we studied in my quantum physics class was the photoelectric effect, initially experimentally investigated by Heinrich Hertz (1887) and later explained in a Nobel Prize-winning paper by one Albert Einstein (1905 paper, 1921 prize). The photoelectric effect involves illuminating a metal plate and collecting the emitted electrons on another plate; while this is oversimplistic, it’s the basic idea of what’s happening.
I drew up this incredibly beautiful and detailed image to illustrate the (again, simplified) experimental apparatus we discussed in class. Disclaimer: I’m a pianist, not a visual artist…
We used an interactive PhET simulation to explore the photoelectric effect for ourselves; fortunately, the PhET image of the apparatus is a lot prettier than my schematic.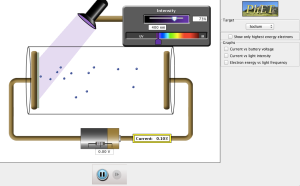
We worked in groups to complete this assignment. Following is a summary of what I learned from this project.
List all the variables you can control in the simulation.
- Intensity/Number of Photons
- Wavelength/frequency
- Current
- Stopping voltage
- Composition of target
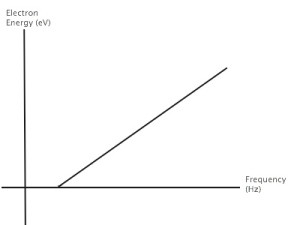
From your knowledge of light, energy, electrons, wavelength, and frequency, sketch your prediction for a graph of electron energy as a function of frequency.
The ejection of electrons is determined by the frequency of the incident light. At low frequencies, even with high intensities, no electrons are ejected. However, once the minimum frequency is achieved, higher intensities result in more electrons being ejected.
Relevant equations:
(Regrettably, WordPress doesn’t include an equation editing tool, so I’m creating these in a non-web-based text editor and inserting them here as image files.)
Decrease the frequency of the light until electrons are no longer ejected. Record the wavelength in Table 1, and complete the calculations. Repeat for each metal.
The minimum amount of energy required for an electron to escape from a metal is called the work function W, and is given by W= hf. Calculate the work function for each of the metals in [J] and [eV] using the previously determined threshold frequencies.
According to Wikipedia’s table of work functions, the mystery element is probably Magnesium.
Choose light of 175 nm and determine the voltage you need so that no electron reaches the surface of the other plate. List the battery voltage you need for each of the elements in the list. After you found the battery voltages for all the given elements, find the one for the “mystery” element. Guess what this element could be.
Relevant equations for this section:
Again citing Wikipedia, the mystery element is now closest to Arsenic.
What affects the number of electrons ejected? Select the metal platinum and adjust the frequency of the incident light slightly above the threshold frequency. Vary the intensity of the light and observe any changes in the number of ejected electrons. Increase the frequency of the incident light until it is well above the threshold frequency. Vary the intensity of the light and observe any changes in the number of ejected electrons. Record your observations and interpret what you see according to what you learned about the photoelectric effect.
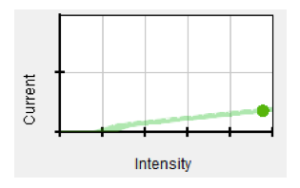
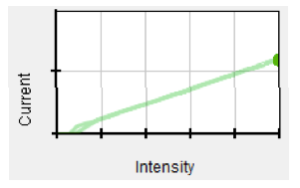
For a platinum target with the wavelength of the incident light at 175nm, intensity and number of ejected electrons are directly proportional (lower intensity ejects fewer electrons), as illustrated in the graph below.
For a platinum target with the wavelength of the incident light at 160nm, intensity and number of ejected electrons are directly proportional as before, with more electrons ejected for each change of intensity.
The ejection of electrons is determined by the frequency of the incident light. At frequencies below the threshold, even with high intensities, no electrons are ejected. However, once the threshold frequency is achieved, higher intensities result in more electrons being ejected.
Design your own experimental setup so that you can repeat his experiment within the simulation. Describe your reasoning for the setup, carry out the experiment, and determine your own value of Planck’s constant.
According to Modern Physics by John Morrison,
Recalling the definition of work as accelerating a charge through a potential, we can see that, where e is the fundamental electric charge,
In this context, V refers to the stopping voltage; substituting the basic relation
![]() we see that h can be determined in terms of quantities which are easy to find within the simulation.
we see that h can be determined in terms of quantities which are easy to find within the simulation.
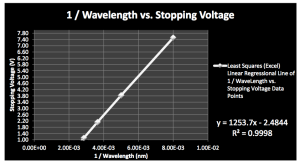
To experimentally determine h, we arbitrarily choose a target composed of sodium. We select λ = 125 nm, then increase it in increments of 75 nm until electrons are no longer ejected, for a total of 5 increments. At each value of λ, we determine the stopping voltage. In Microsoft Excel, we graph 1/ λ as he independent variable and stopping voltage as the dependent variable. The slope of this graph is hc/e, from which it’s easy to determine the value of h.
“In fact, the mere act of opening the box will determine the state of the
cat, although in this case there were three determinate states the cat
could be in: these being Alive, Dead, and Bloody Furious.”
Terry Pratchett, Lords and Ladies
